For the last few weeks I have been working on the redesign of a website and integrating it into a new CMS. It was also the first web project I’ve worked on that was designed to work on mobiles from the get go.
Although I keep abreast of the latest developments via blogs, podcasts and conferences, a real responsive website had yet “to cross my desk” so to speak.
One of the biggest challenges I found on this project was tweaking the design of the site on a mobile device. Inevitably design choices that were made for a desktop site bled into the mobile one and needed to be tweaked.
Tooling for this has come a long way over the last couple of years, with built in developer tools in major browsers like Safari and Chrome, device emulators for iOS and Android, and even complete testing suites in the cloud.
Responsive Preview
A handy tool to get the ball rolling was the responsive preview function that was built in to the CMS. Umbraco 7.2, a minty fresh version of the popular open source .NET Content Management Server, has a handy preview function that allows the editor to preview their page on different devices by changing the viewport.
https://player.vimeo.com/video/113603024
It’s a really handy tool to get a quick impression of how the design will look on differently scaled devices. A big bonus of this feature is that content editors can see for themselves how their content would look and feel on different devices. It was also instrumental in getting them out of the habit of adding manual <br/>s in their content to make it look “just right” on their own machines.
Chrome Device Mode
Debugging content was one thing, but actually getting into the HTML and CSS was another matter. For that I turned to the great Device Mode tools built into into recent versions of Google Chrome. These tools up the ante and don’t just manipulate the viewport but also allow you to use the document inspector to evaluate CSS and JavaScript and see how your website is affected by your code.

Device Mode in action
Other handy features include network throttling (for emulating 2G and 3G mobile phone speeds) and manipulating geolocation data for location-aware HTML5 apps.
As handy as these tools are, they still render your web app using the internal web engine of Chrome on the desktop.
On the occasion that your website has a bug that only shows up on say on iPhone and not in the Device Mode emulator you’ll have to look further afield. Both Google and Apple have hooks into their devices so that you can debug them remotely.
Chrome has the ability to connect to Android devices through a USB cable while the Apple solution allows you to remotely connect to on iOS device if is on the same network and you connect to it from a workstation running MacOS X.
Platform agnostic debugging with Weinre
That’s all well if you have a full Device Lab at your disposal but I only had my personal iPhone and iPad and a PC running Windows.
When you listen to as many podcasts as I do, there always a topic that comes up where you think “that’s cool, I could use that some time”. Similarly I once heard about debugging websites remotely but it must have been a while back as I can’t remember where I heard it, so no attributions I’m afraid.
One of the remote debugging tools that stood out was due to it’s curious name, Weinre. It’s pronounced “winery” or “wien-RE” depending on your lovely choice of accent. It is actually an acronym for WEb INspector REmote, but who has time for long names? We in IT love acronyms, don’t we?
One of the biggest advantages of the Weinre set-up is that it is truly platform agnostic. It uses the power of JavaScript to parse the DOM on the device and sends the data back to a server that displays the results in a friendly interface very similar to the desktop web inspectors we know and love.
To set it all up you need the following:
- A workstation running Node.js (a server-side JavaScript environment)
- Weinre installed on top of Node.js
- A running Weinre server on your workstation
- A JavaScript include in your web app that points to your Weinre server
- Use the remote inspector
Although the setup is similar for most platforms, I will describe here how I got my set-up working.
1. Installing Node.js
As Weinre requires Node.js to run, the first step involves getting Node.js setup on your machine.
Head on over to the Node.js website and download the installer for your environment.
In my case I downloaded the Windows Installer 64 bit version.
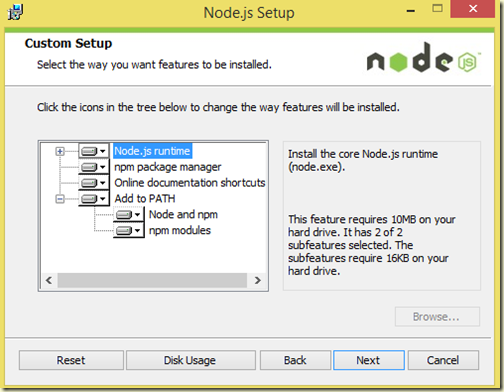
Make sure that you include the npm package manager and Add to PATH options as you’ll need those for the next steps.
To check if Node.js installed correctly, open a new instance of the Windows Command Prompt and type
node –v
You should get back the version of the environment you just installed.
As a final step you should also check if the package manager is up and running. For that you should type in the command
npm –v
2. Installing Weinre
After you have successfully installed Node.js on your machine you can then use the package manager to install Weinre.
Again from the command prompt, run the command npm command to install Weinre:
npm –g Weinre
3. Running Weinre
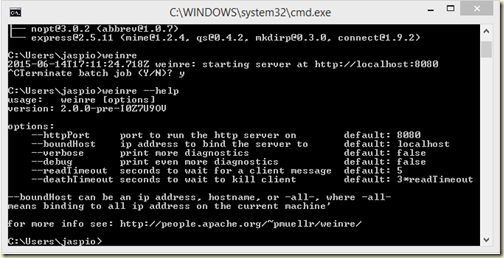
After NPM has finished installing Weinre you should be able to run it using the command
weinre –boundHost –all-
The boundHost flag allows other machines in your network to connect to your server. Without it you would be unable to connect using 127.0.0.1 loopback.
In case you need to set it up using a different port you can use the command
weinre –help
to find the correct flags.
note: you can stop Weinre by calling terminate command using
Ctrl+C
4. Connecting clients to the Weinre server
The final step of setting up Weinre is to inject a piece of JavaScript that points your clients to your Weinre server. The easiest way to do this is to point your browser to http://localhost:8080 and follow the instructions on screen.
You can either choose to inject the needed JavaScript via a bookmarklet or, my preferred method, is to add the target script to the header of your application:
Note that if you want to connect your devices you will need to change the address from localhost to something your clients can reach. Either use a DNS name or the IP address of your server, in my case I used dotsero.local to connect to my server named Dotsero (I name all my devices after volcanoes).
After you have added the target script to you can go ahead and connect your client(s). On your device, pull up the web app you want to to debug. As it loads it will also pick up the extra JavaScript and connect to your server.
5. Using the remote inspector
With your client connected, you should now be able to use the Remote Inspector.
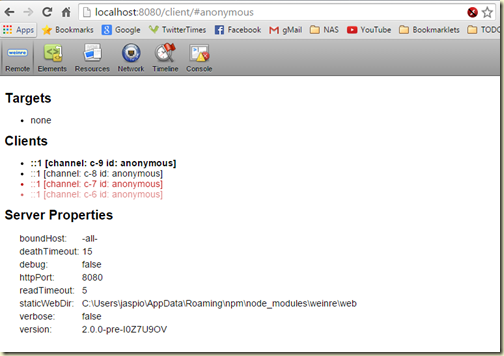
From your server, open up a new browser tab and point it to http://localhost:8080/client/#anonymous. This is the dashboard from which you can select the connected client you wish to inspect.
When your clients are connected, you should see them popup in the Targets list.
(I won’t paste it here as I don’t want to publish my iPhone’s MAC address).
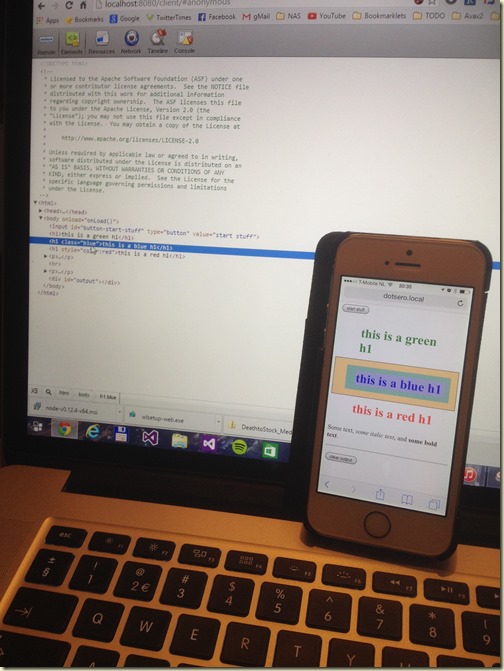
Eh voilà: you should be able to remotely inspect the website on your mobile!


Leave a Reply